| ... | ... | @@ -49,7 +49,151 @@ For more information about rrdtool and rrds look at http://oss.oetiker.ch/rrdtoo |
|
|
|
|
|
|
|
|
|
|
|
|
|
|
|
How to draw graphs out of the rrd-file
|
|
|
|
------------------------------------------------------
|
|
|
|
|
|
|
|
When you recorded some sensor-data to your rrd, you can create funky graphs with rrdtool. The following bash-script gives an example for creating a graph of the last 24 hours for every sensor:
|
|
|
|
|
|
|
|
> #! /bin/bash
|
|
|
|
>
|
|
|
|
> RRDTOOL="/usr/bin/rrdtool"
|
|
|
|
> RRD_DB="/path/to/data_airpi.rrd"
|
|
|
|
>
|
|
|
|
> GRAPH_PATH="/path/to/save/images"
|
|
|
|
>
|
|
|
|
>
|
|
|
|
> $RRDTOOL graph $GRAPH_PATH/airpi-tempbmp-day.png -a PNG --width=800 --height=300 \
|
|
|
|
> --start -1d --pango-markup --vertical-label 'temperature (°C)' --lower-limit 0 \
|
|
|
|
> DEF:temp=$RRD_DB:tempbmp:AVERAGE \
|
|
|
|
> DEF:tempmin=$RRD_DB:tempbmp:MIN \
|
|
|
|
> DEF:tempmax=$RRD_DB:tempbmp:MAX \
|
|
|
|
> AREA:temp#FF4141 \
|
|
|
|
> LINE1:temp#bf3434:"<big>temperature (BMP085)</big> " \
|
|
|
|
> VDEF:temp_min=temp,MINIMUM \
|
|
|
|
> 'GPRINT:temp_min:<b>minimum</b>\: %5.0lf °C ' \
|
|
|
|
> VDEF:temp_average=temp,AVERAGE \
|
|
|
|
> 'GPRINT:temp_average:<b>average</b>\: %5.0lf °C ' \
|
|
|
|
> VDEF:temp_max=temp,MAXIMUM \
|
|
|
|
> 'GPRINT:temp_max:<b>maximum</b>\: %5.0lf °C ' \
|
|
|
|
> > /dev/null
|
|
|
|
>
|
|
|
|
> $RRDTOOL graph $GRAPH_PATH/airpi-tempdht-day.png -a PNG --width=800 --height=300 \
|
|
|
|
> --start -1d --pango-markup --vertical-label 'temperature (°C)' --lower-limit 0 \
|
|
|
|
> DEF:temp=$RRD_DB:tempdht:AVERAGE \
|
|
|
|
> DEF:tempmin=$RRD_DB:tempdht:MIN \
|
|
|
|
> DEF:tempmax=$RRD_DB:tempdht:MAX \
|
|
|
|
> AREA:temp#FF4141 \
|
|
|
|
> LINE1:temp#bf3434:"<big>temperature (DHT22)</big> " \
|
|
|
|
> VDEF:temp_min=temp,MINIMUM \
|
|
|
|
> 'GPRINT:temp_min:<b>minimum</b>\: %5.0lf °C ' \
|
|
|
|
> VDEF:temp_average=temp,AVERAGE \
|
|
|
|
> 'GPRINT:temp_average:<b>average</b>\: %5.0lf °C ' \
|
|
|
|
> VDEF:temp_max=temp,MAXIMUM \
|
|
|
|
> 'GPRINT:temp_max:<b>maximum</b>\: %5.0lf °C ' \
|
|
|
|
> > /dev/null
|
|
|
|
>
|
|
|
|
> $RRDTOOL graph $GRAPH_PATH/airpi-press-day.png -a PNG --width=800 --height=300 --lower-limit 950 \
|
|
|
|
> --start -1d --pango-markup --vertical-label 'pressure (hPa)' --upper-limit 1050 --units-exponent 0 \
|
|
|
|
> DEF:press=$RRD_DB:press:AVERAGE \
|
|
|
|
> DEF:pressmin=$RRD_DB:press:MIN \
|
|
|
|
> DEF:pressmax=$RRD_DB:press:MAX \
|
|
|
|
> AREA:press#FF4141 \
|
|
|
|
> LINE1:press#bf3434:"<big>pressure (BMP085)</big> " \
|
|
|
|
> VDEF:press_min=press,MINIMUM \
|
|
|
|
> 'GPRINT:press_min:<b>minimum</b>\: %5.0lf hPa ' \
|
|
|
|
> VDEF:press_average=press,AVERAGE \
|
|
|
|
> 'GPRINT:press_average:<b>average</b>\: %5.0lf hPa ' \
|
|
|
|
> VDEF:press_max=press,MAXIMUM \
|
|
|
|
> 'GPRINT:press_max:<b>maximum</b>\: %5.0lf hPa ' \
|
|
|
|
> > /dev/null
|
|
|
|
>
|
|
|
|
> $RRDTOOL graph $GRAPH_PATH/airpi-humi-day.png -a PNG --width=800 --height=300 \
|
|
|
|
> --start -1d --pango-markup --vertical-label 'humidity (%)' --lower-limit 0 --upper-limit 100 \
|
|
|
|
> DEF:humi=$RRD_DB:humi:AVERAGE \
|
|
|
|
> DEF:humimin=$RRD_DB:humi:MIN \
|
|
|
|
> DEF:humimax=$RRD_DB:humi:MAX \
|
|
|
|
> AREA:humi#FF4141 \
|
|
|
|
> LINE1:humi#bf3434:"<big>humidity (DHT22)</big> " \
|
|
|
|
> VDEF:humi_min=humi,MINIMUM \
|
|
|
|
> 'GPRINT:humi_min:<b>minimum</b>\: %5.0lf %% ' \
|
|
|
|
> VDEF:humi_average=humi,AVERAGE \
|
|
|
|
> 'GPRINT:humi_average:<b>average</b>\: %5.0lf %% ' \
|
|
|
|
> VDEF:humi_max=humi,MAXIMUM \
|
|
|
|
> 'GPRINT:humi_max:<b>maximum</b>\: %5.0lf %% ' \
|
|
|
|
> > /dev/null
|
|
|
|
>
|
|
|
|
> $RRDTOOL graph $GRAPH_PATH/airpi-light-day.png -a PNG --width=800 --height=300 \
|
|
|
|
> --start -1d --pango-markup --vertical-label 'light intensity (%)' --lower-limit 0 --upper-limit 110 \
|
|
|
|
> DEF:light=$RRD_DB:light:AVERAGE \
|
|
|
|
> DEF:lightmax=$RRD_DB:light:MAX \
|
|
|
|
> CDEF:scaled_light=light,10250000,/ \
|
|
|
|
> CDEF:light_inverse=1,scaled_light,- \
|
|
|
|
> CDEF:light_percent=light_inverse,100,* \
|
|
|
|
> AREA:light_percent#FF4141 \
|
|
|
|
> LINE1:light_percent#bf3434:"<big>light intensity (LDR)</big> " \
|
|
|
|
> VDEF:light_min=light_percent,MINIMUM \
|
|
|
|
> 'GPRINT:light_min:<b>minimum</b>\: %5.0lf %% ' \
|
|
|
|
> VDEF:light_average=light_percent,AVERAGE \
|
|
|
|
> 'GPRINT:light_average:<b>average</b>\: %5.0lf %% ' \
|
|
|
|
> VDEF:light_max=light_percent,MAXIMUM \
|
|
|
|
> 'GPRINT:light_max:<b>maximum</b>\: %5.0lf %% ' \
|
|
|
|
> > /dev/null
|
|
|
|
>
|
|
|
|
> $RRDTOOL graph $GRAPH_PATH/airpi-no2-day.png -a PNG --width=800 --height=300 \
|
|
|
|
> --start -1d --pango-markup --vertical-label 'nitrogen dioxide' \
|
|
|
|
> DEF:no2=$RRD_DB:no2:AVERAGE \
|
|
|
|
> DEF:no2min=$RRD_DB:no2:MIN \
|
|
|
|
> DEF:no2max=$RRD_DB:no2:MAX \
|
|
|
|
> AREA:no2#FF4141 \
|
|
|
|
> LINE1:no2#bf3434:"<big>nitrogen dioxide (MiCS-2710)</big> " \
|
|
|
|
> VDEF:no2_min=no2,MINIMUM \
|
|
|
|
> 'GPRINT:no2_min:<b>minimum</b>\: %5.0lf ' \
|
|
|
|
> VDEF:no2_average=no2,AVERAGE \
|
|
|
|
> 'GPRINT:no2_average:<b>average</b>\: %5.0lf ' \
|
|
|
|
> VDEF:no2_max=no2,MAXIMUM \
|
|
|
|
> 'GPRINT:no2_max:<b>maximum</b>\: %5.0lf ' \
|
|
|
|
> > /dev/null
|
|
|
|
>
|
|
|
|
> $RRDTOOL graph $GRAPH_PATH/airpi-co-day.png -a PNG --width=800 --height=300 \
|
|
|
|
> --start -1d --pango-markup --vertical-label 'carbon monoxide' \
|
|
|
|
> DEF:co=$RRD_DB:co:AVERAGE \
|
|
|
|
> DEF:comin=$RRD_DB:co:MIN \
|
|
|
|
> DEF:comax=$RRD_DB:co:MAX \
|
|
|
|
> AREA:co#FF4141 \
|
|
|
|
> LINE1:co#bf3434:"<big>carbon monoxide (MiCS-5525)</big> " \
|
|
|
|
> VDEF:co_min=co,MINIMUM \
|
|
|
|
> 'GPRINT:co_min:<b>minimum</b>\: %5.0lf ' \
|
|
|
|
> VDEF:co_average=co,AVERAGE \
|
|
|
|
> 'GPRINT:co_average:<b>average</b>\: %5.0lf ' \
|
|
|
|
> VDEF:co_max=co,MAXIMUM \
|
|
|
|
> 'GPRINT:co_max:<b>maximum</b>\: %5.0lf ' \
|
|
|
|
> > /dev/null
|
|
|
|
>
|
|
|
|
> $RRDTOOL graph $GRAPH_PATH/airpi-vol-day.png -a PNG --width=800 --height=300 \
|
|
|
|
> --start -1d --pango-markup --vertical-label 'noise' \
|
|
|
|
> DEF:vol=$RRD_DB:vol:AVERAGE \
|
|
|
|
> DEF:volmin=$RRD_DB:vol:MIN \
|
|
|
|
> DEF:volmax=$RRD_DB:vol:MAX \
|
|
|
|
> AREA:vol#FF4141 \
|
|
|
|
> LINE1:vol#bf3434:"<big>noise (ABM_713_RC)</big> " \
|
|
|
|
> VDEF:vol_min=vol,MINIMUM \
|
|
|
|
> 'GPRINT:vol_min:<b>minimum</b>\: %5.0lf ' \
|
|
|
|
> VDEF:vol_average=vol,AVERAGE \
|
|
|
|
> 'GPRINT:vol_average:<b>average</b>\: %5.0lf ' \
|
|
|
|
> VDEF:vol_max=vol,MAXIMUM \
|
|
|
|
> 'GPRINT:vol_max:<b>maximum</b>\: %5.0lf ' \
|
|
|
|
> > /dev/null
|
|
|
|
|
|
|
|
by changing the parameter
|
|
|
|
> --start -1d
|
|
|
|
to
|
|
|
|
> --start -1(w/m/y)
|
|
|
|
you can switch from a dayly graph to weekly (w), monthly (m) or yearly (y).
|
|
|
|
|
|
|
|
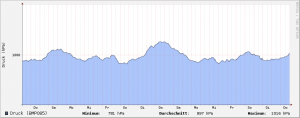
your graph will look something like this:
|
|
|
|
|
|
|
|
|
|
|
|
For more information about graph generation with rrdtool look at http://oss.oetiker.ch/rrdtool/index.en.html
|
|
|
|
|
|
|
|
|
|
|
|
|
| ... | ... | |