|
|
|
RRD support
|
|
|
|
===========
|
|
|
|
|
|
|
|
If you built your AirPi as suggested on http://airpi.es , no customization on outputs/rrd.py is needed.
|
|
|
|
The only thing you have to do, is adding the rrd output to your outputs.cfg:
|
|
|
|
If you built your AirPi as suggested on http://airpi.es , no customization on **outputs/rrd.py** is needed.
|
|
|
|
The only thing you have to do, is adding the rrd output to your **outputs.cfg**:
|
|
|
|
|
|
|
|
|
|
|
|
[RRD]
|
|
|
|
filename=rrd
|
|
|
|
enabled=on
|
|
|
|
rrd_file=rrd/data_airpi.rrd
|
|
|
|
|
|
|
|
|
|
|
|
The parameter rrd_file points to your rrd, generated with the following commands:
|
|
|
|
|
|
|
|
|
|
|
|
rrdtool create /srv/airpi/data_airpi.rrd --step=120 \
|
|
|
|
DS:tempbmp:GAUGE:180:-273:5000 \
|
|
|
|
DS:tempdht:GAUGE:180:-273:5000 \
|
| ... | ... | @@ -45,6 +48,7 @@ The parameter rrd_file points to your rrd, generated with the following commands |
|
|
|
RRA:MAX:0.5:52560:3200 \
|
|
|
|
RRA:MAX:0.5:525600:3200
|
|
|
|
|
|
|
|
|
|
|
|
For more information about rrdtool and rrds look at http://oss.oetiker.ch/rrdtool/index.en.html
|
|
|
|
|
|
|
|
|
| ... | ... | @@ -54,6 +58,7 @@ How to draw graphs out of the rrd-file |
|
|
|
|
|
|
|
When you recorded some sensor-data to your rrd, you can create funky graphs with rrdtool. The following bash-script gives an example for creating a graph of the last 24 hours for every sensor:
|
|
|
|
|
|
|
|
|
|
|
|
#! /bin/bash
|
|
|
|
|
|
|
|
RRDTOOL="/usr/bin/rrdtool"
|
| ... | ... | @@ -184,6 +189,8 @@ When you recorded some sensor-data to your rrd, you can create funky graphs with |
|
|
|
'GPRINT:vol_max:<b>maximum</b>\: %5.0lf ' \
|
|
|
|
> /dev/null
|
|
|
|
|
|
|
|
|
|
|
|
|
|
|
|
by changing the parameter
|
|
|
|
> --start -1d
|
|
|
|
|
| ... | ... | @@ -191,11 +198,14 @@ to |
|
|
|
|
|
|
|
> --start -1(w/m/y)
|
|
|
|
|
|
|
|
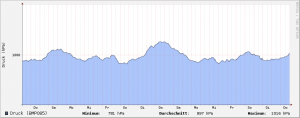
you can switch from a dayly graph to weekly (w), monthly (m) or yearly (y).
|
|
|
|
you can switch from a dayly graph to **weekly** (w), **monthly** (m) or **yearly** (y).
|
|
|
|
|
|
|
|
|
|
|
|
|
|
|
|
your graph will look something like this:
|
|
|
|
|
|
|
|
|
|
|
|
|
|
|
|
For more information about graph generation with rrdtool look at http://oss.oetiker.ch/rrdtool/index.en.html
|
|
|
|
|
|
|
|
|
| ... | ... | |